Pentest Orchestration Architecture
This document explains how the AI pentest orchestrator works under the hood — which steps use the LLM, what context is passed at each stage, and how findings are correlated back to source code.
High-Level Flow
What the LLM Sees
The orchestrator constructs a system prompt containing all available context. Here is exactly what is passed to the LLM at the start of each session:
System Prompt Structure
┌─────────────────────────────────────────────────────────┐
│ SYSTEM PROMPT                                           │
├─────────────────────────────────────────────────────────┤
│ ## Target                                               │
│ Name, URL, type, rate limit, destructive flag, repo ID  │
│                                                         │
│ ## Strategy                                             │
│ Guidance text based on selected strategy                │
│                                                         │
│ ## SAST Findings (Static Analysis)                      │
│ Up to 20 findings with severity, file:line, CWE        │
│ ← From linked repository's SAST scan                   │
│                                                         │
│ ## Vulnerable Dependencies (SBOM)                       │
│ Up to 15 entries with package, version, CVE IDs         │
│ ← From linked repository's SBOM scan                   │
│                                                         │
│ ## Code Entry Points (Knowledge Graph)                  │
│ Up to 20 entry points with endpoint → file mapping      │
│ Each linked to SAST findings in the same file           │
│ ← From code knowledge graph build                      │
│                                                         │
│ ## Authentication (if configured)                       │
│ Mode, credentials (decrypted), registration URL         │
│ Verification email for plus-addressing                  │
│                                                         │
│ ## Custom HTTP Headers                                  │
│ Key-value pairs to include in all requests              │
│                                                         │
│ ## Scope Exclusions                                     │
│ Paths the LLM must not test                             │
│                                                         │
│ ## Available Tools                                      │
│ List of all registered tool names                       │
│                                                         │
│ ## Instructions                                         │
│ Step-by-step testing methodology                        │
└─────────────────────────────────────────────────────────┘
Per-Iteration Messages
After the system prompt, each LLM call includes the full conversation history:
| Role | Content |
|---|---|
system | System prompt (above) |
user | Initial instructions or user message |
assistant | LLM reasoning + tool call requests |
tool | Tool execution results (one per tool call) |
assistant | Next reasoning + tool calls |
| ... | Continues until LLM says "testing complete" or max 50 iterations |
Tool Registry
The LLM can invoke any of these tools. Each tool is registered with a JSON Schema that the LLM uses for structured tool calling:
| Tool | Category | What it does |
|---|---|---|
recon | Recon | HTTP fingerprinting, technology detection |
openapi_parser | API | Discover endpoints from OpenAPI/Swagger specs |
security_headers | Headers | Check for missing security headers |
cookie_analyzer | Cookies | Analyze cookie flags (Secure, HttpOnly, SameSite) |
csp_analyzer | CSP | Evaluate Content-Security-Policy directives |
cors_checker | CORS | Test CORS misconfiguration |
tls_analyzer | TLS | Inspect TLS certificate and cipher suites |
dns_checker | DNS | DNS record enumeration |
dmarc_checker | DMARC/SPF/DKIM verification | |
rate_limit_tester | Rate Limit | Test rate limiting on endpoints |
console_log_detector | Logs | Find console.log leakage in JavaScript |
sql_injection | SQLi | SQL injection testing with payloads |
xss | XSS | Cross-site scripting testing |
ssrf | SSRF | Server-side request forgery testing |
auth_bypass | Auth | Authentication bypass testing |
api_fuzzer | Fuzzer | API endpoint fuzzing |
browser | Browser | Headless Chrome automation (navigate, click, fill, screenshot, evaluate JS) |
Browser Tool
The browser tool gives the LLM full control of a headless Chrome instance via CDP (Chrome DevTools Protocol). It supports:
- navigate — Go to a URL, return title
- screenshot — Capture PNG screenshot (base64)
- click — Click a CSS-selected element
- fill — Fill a form field with a value
- get_content — Read full page HTML
- evaluate — Execute arbitrary JavaScript
This is used for registration page discovery, form filling, and visual inspection.
Session Lifecycle
SSE Streaming
Each session has a dedicated broadcast channel. The /sessions/{id}/stream endpoint:
- Replays stored messages and attack chain nodes as an initial burst
- Subscribes to the live broadcast for real-time events
- Keepalive comments every 15 seconds
Event types:
| Event | When |
|---|---|
tool_start | LLM requests a tool execution |
tool_complete | Tool finishes with summary + finding count |
finding | New vulnerability discovered |
message | LLM sends a text message |
paused | Session paused |
resumed | Session resumed |
complete | Session finished |
error | Session failed |
Code-Level Correlation in Reports
When a DAST finding is linked to source code, the report includes a Code-Level Remediation section showing exactly what to fix:
Correlation Channels
| Channel | Priority | What it shows |
|---|---|---|
| SAST Correlation | 1 (direct link) | Exact file:line, vulnerable code snippet (red), suggested fix (green), scanner rule, CWE |
| Code Entry Point | 2 (endpoint match) | Handler function, source file, all SAST issues in that file |
| Vulnerable Dependency | 3 (CVE match) | Package name + version, CVE IDs, PURL, upgrade guidance |
Example Report Finding
A finding like "Reflected XSS in /api/search" would show:
- The DAST evidence (request, response, payload)
- SAST Correlation:
src/routes/search.rs:42— semgrep found unescaped user input - Code snippet: The vulnerable line highlighted in red
- Suggested fix: The patched code in green
- Recommendation: Framework-specific guidance
Screenshots
Pentest Dashboard
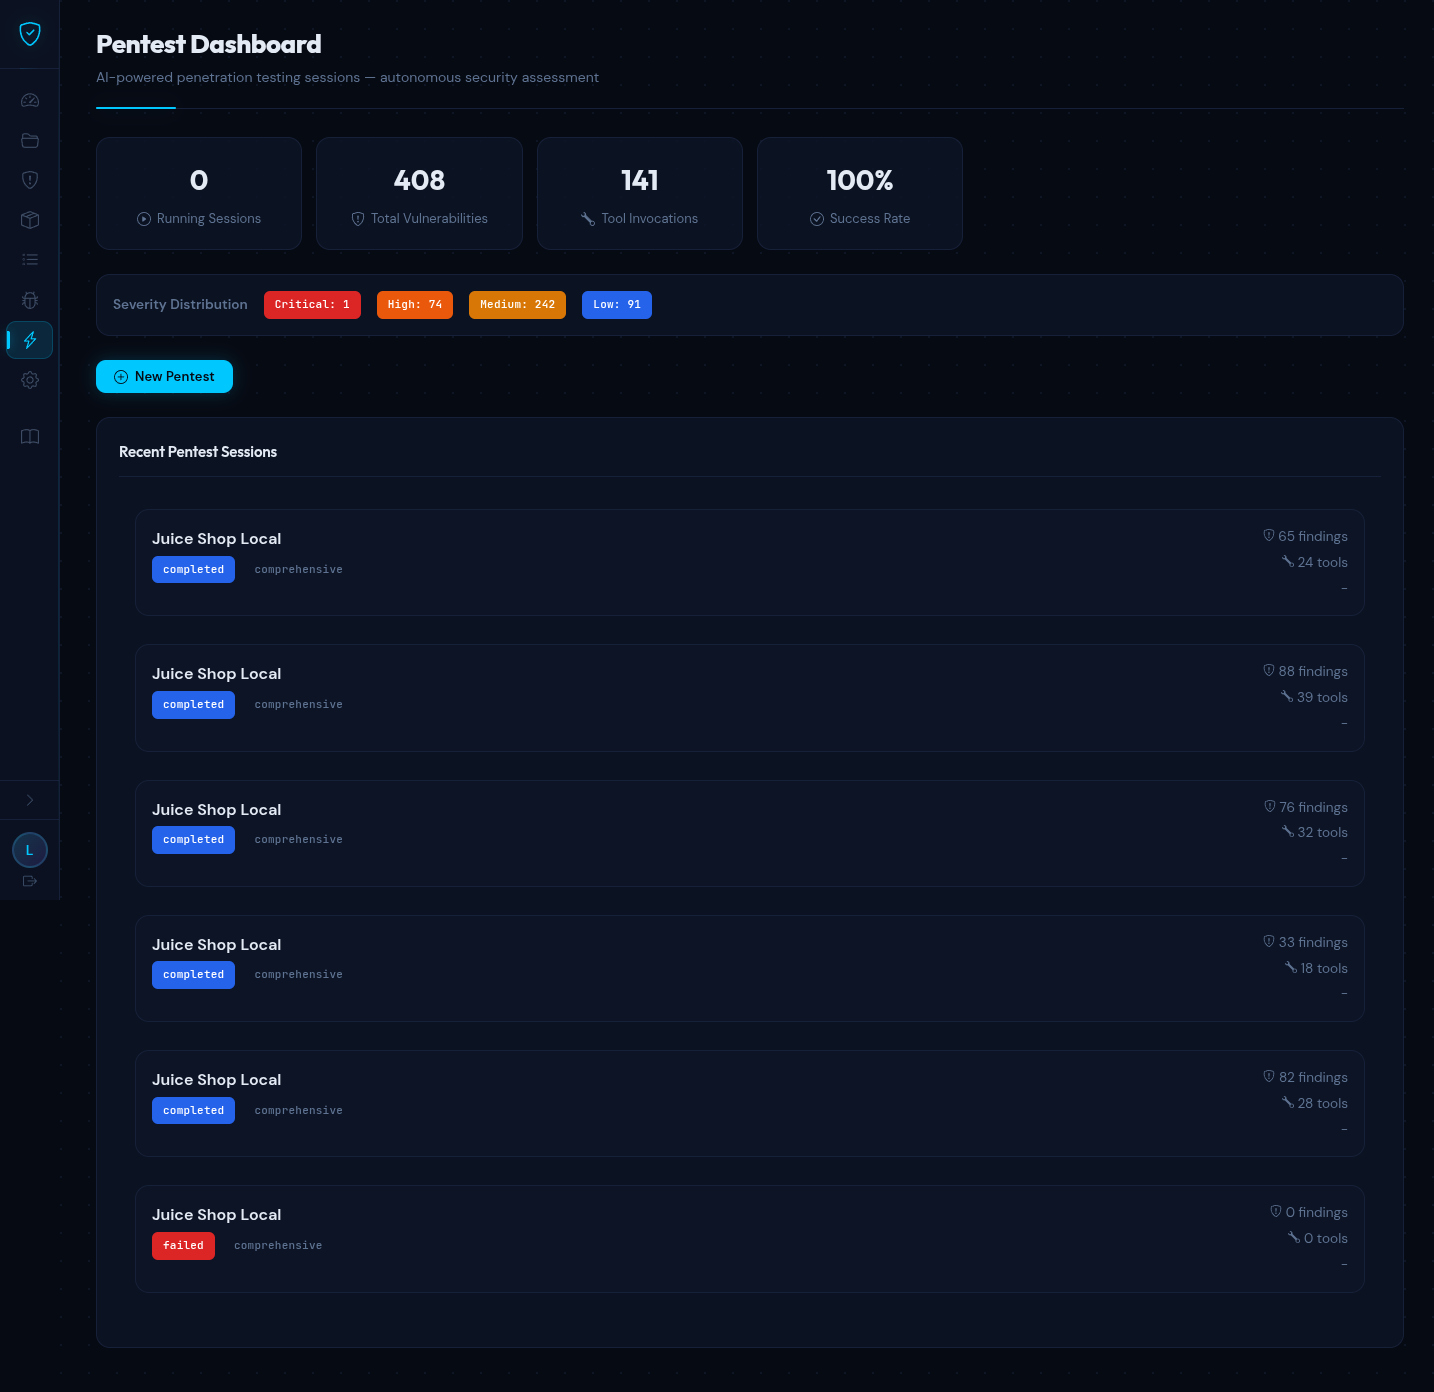
The dashboard shows aggregate statistics, severity distribution, and recent sessions with status badges. Running sessions can be paused, resumed, or stopped.
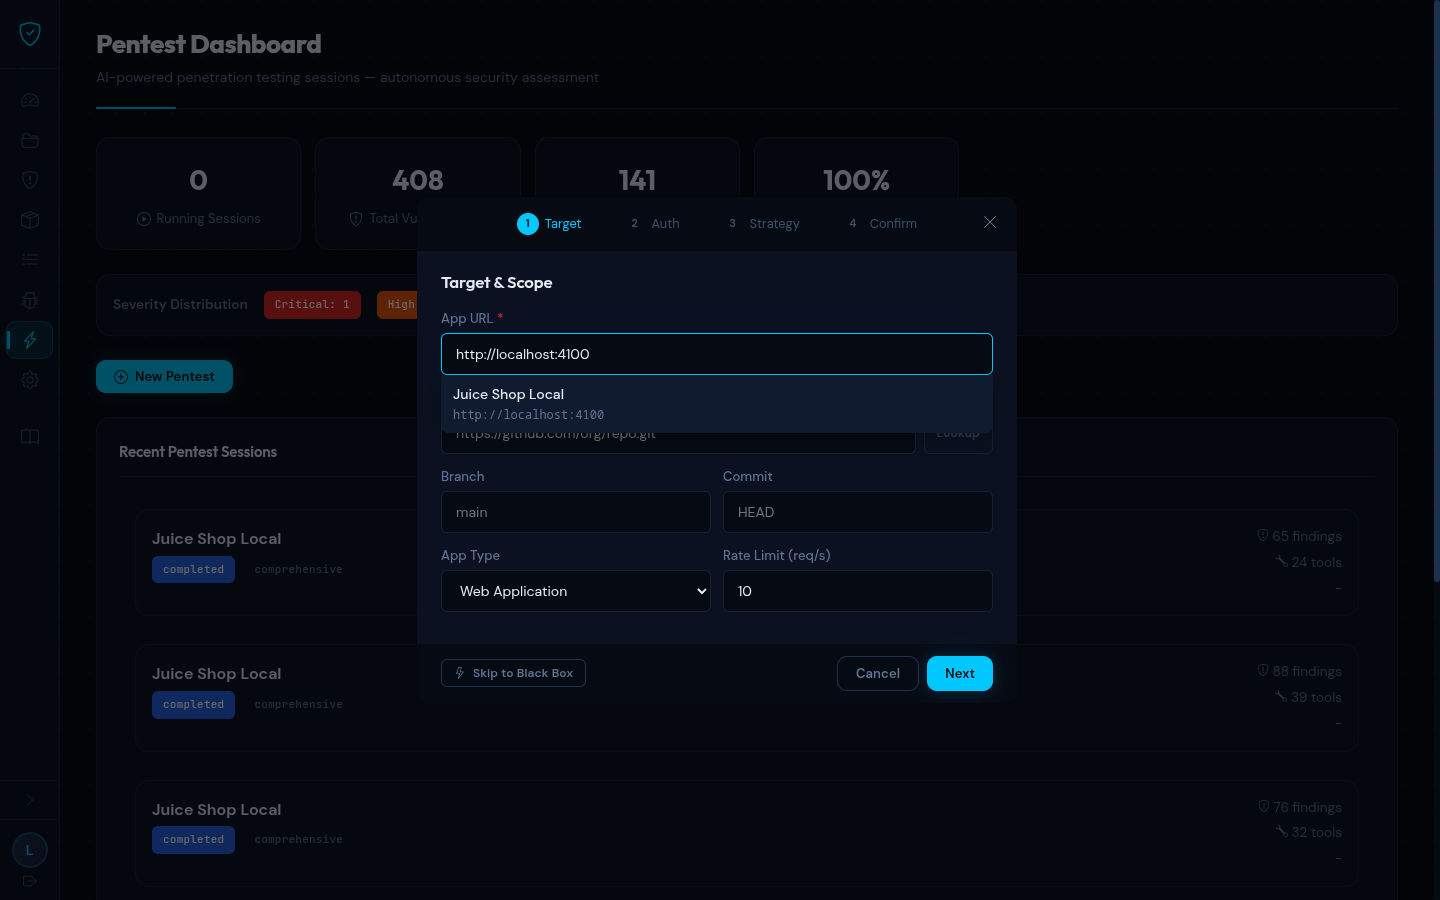
Onboarding Wizard
Step 1 — Target & Scope (with dropdown showing existing DAST targets):
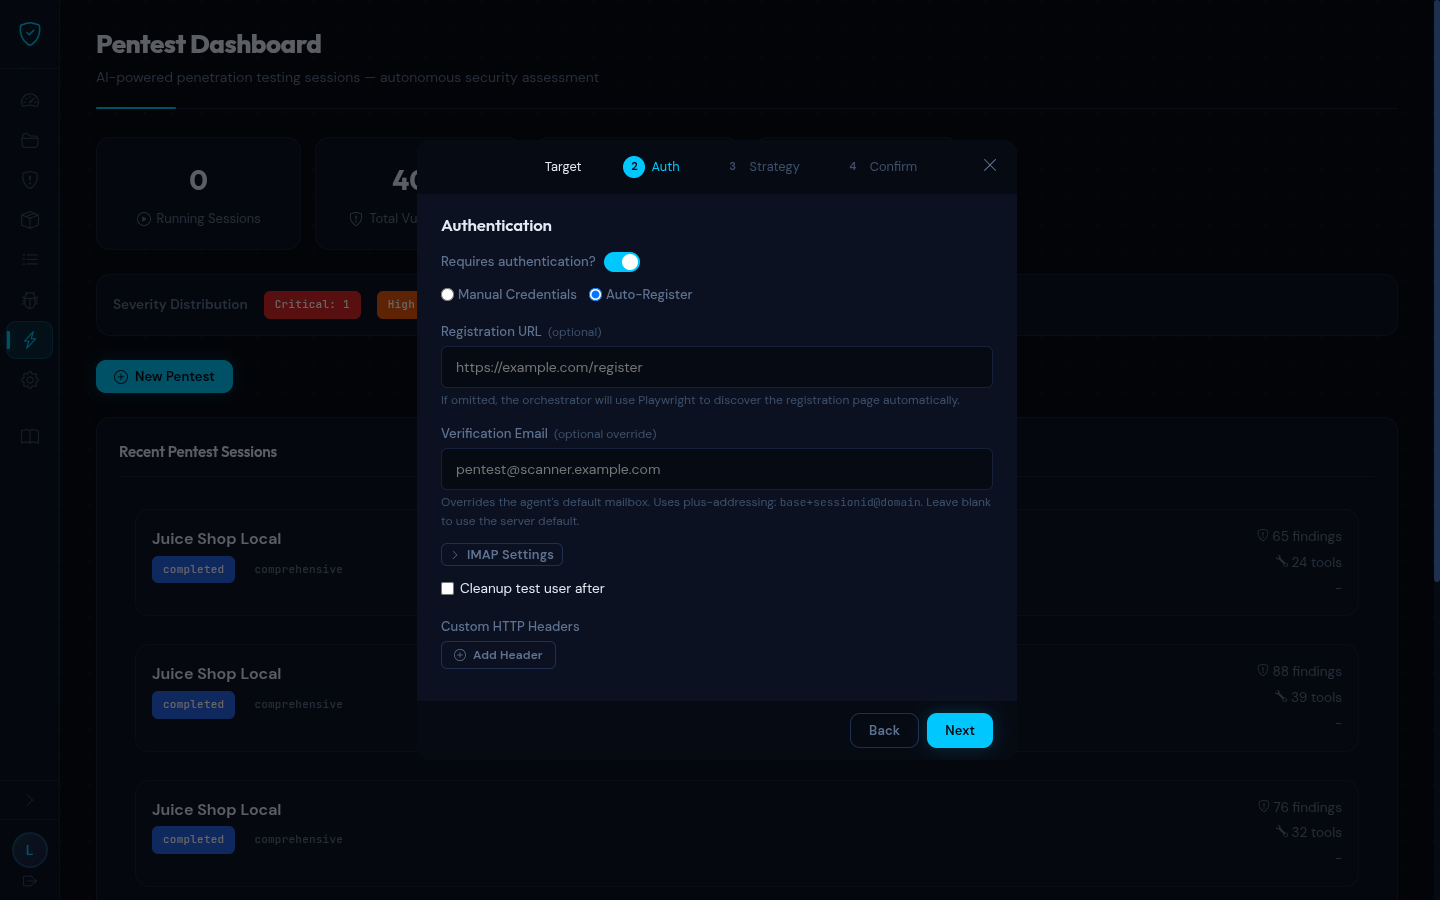
Step 2 — Authentication (Auto-Register mode with optional registration URL, verification email, IMAP settings):
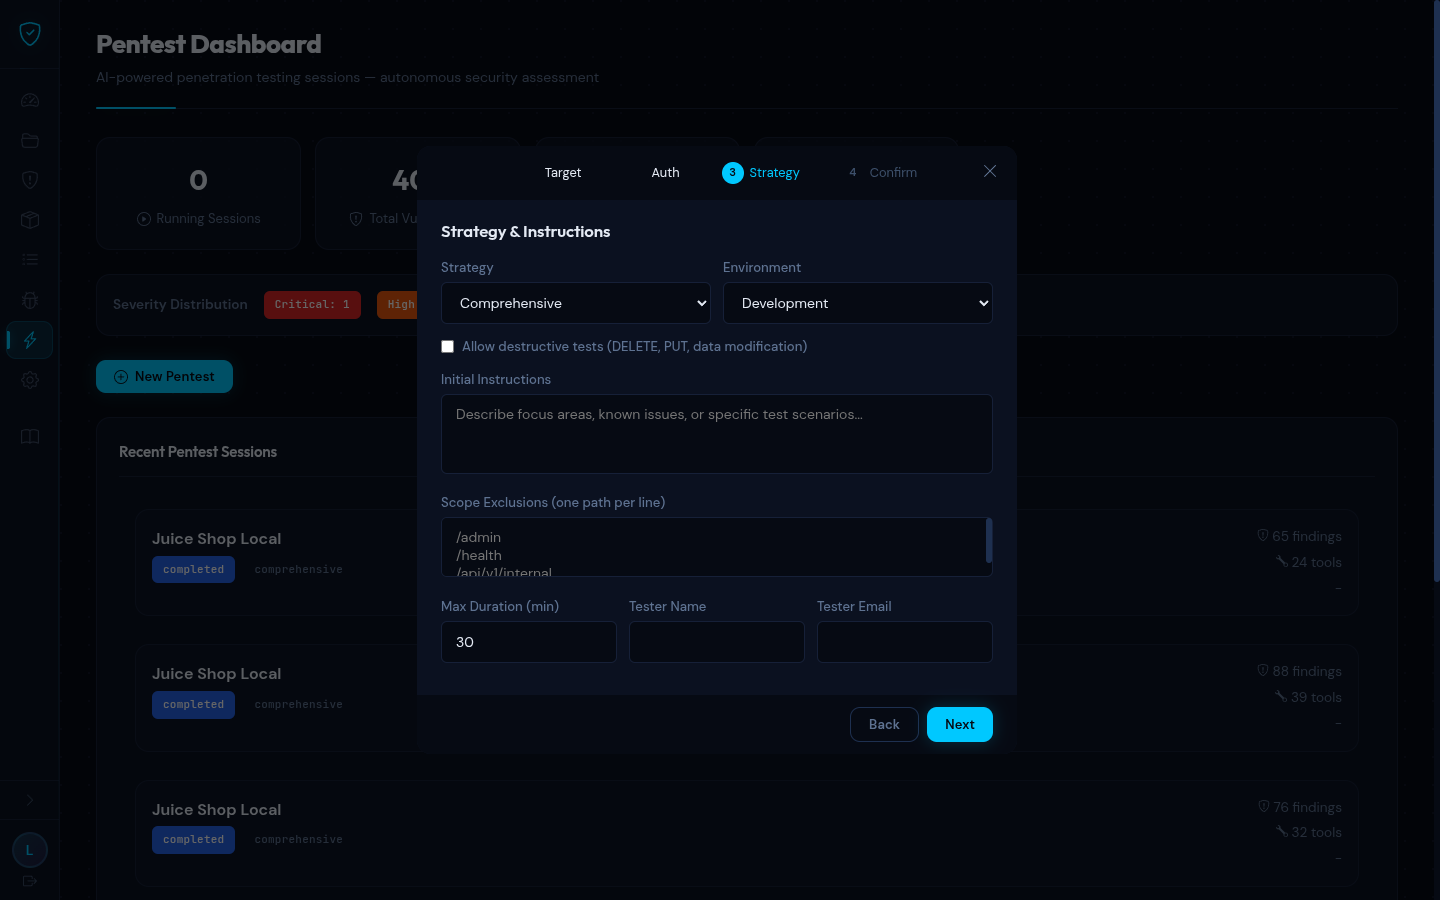
Step 3 — Strategy & Instructions (strategy selection, scope exclusions, duration, tester info):
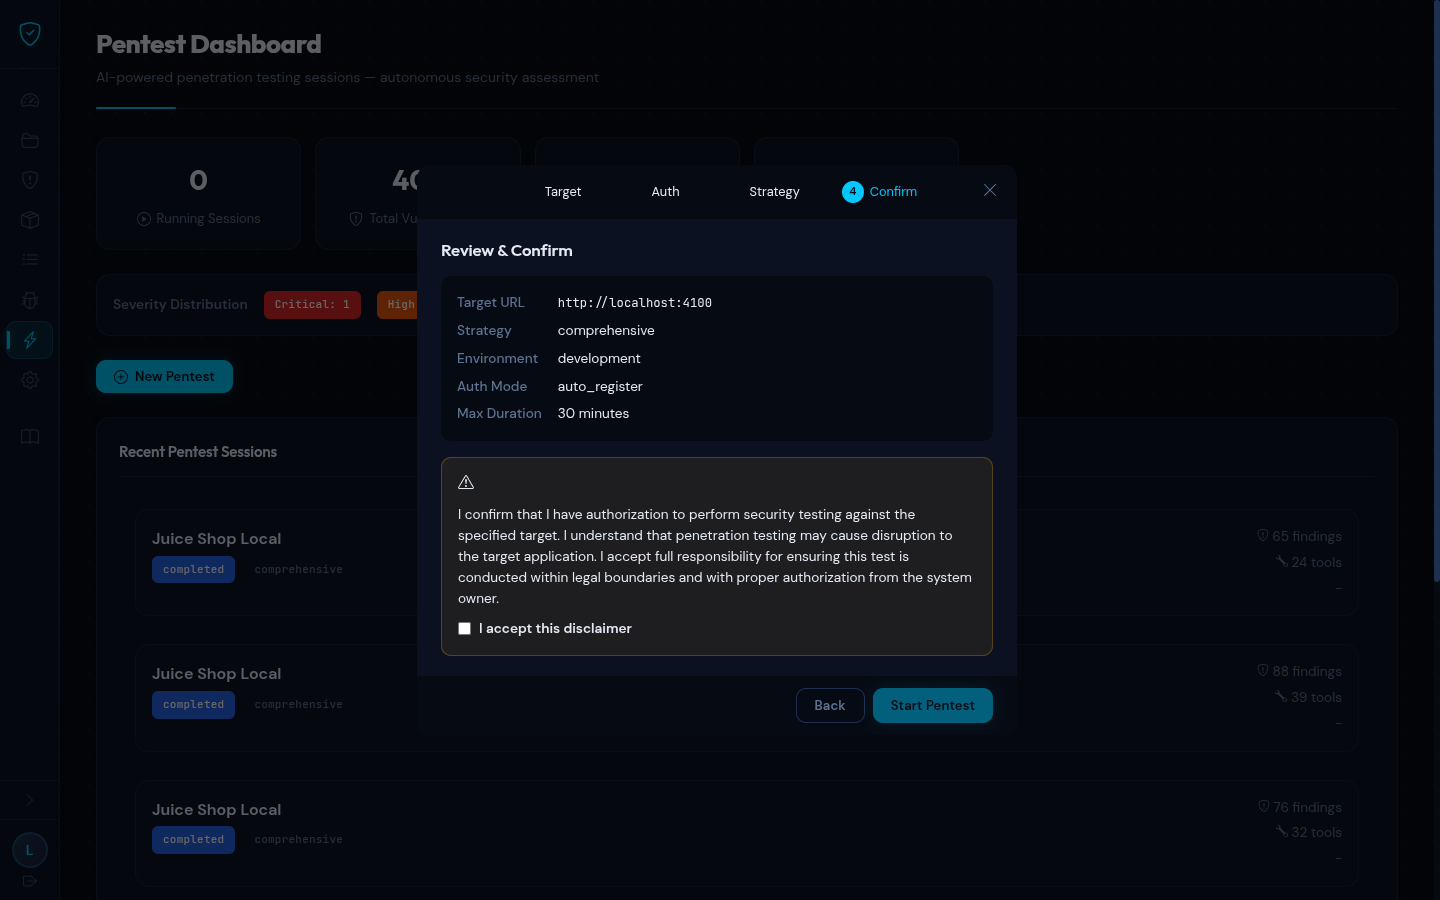
Step 4 — Review & Confirm (summary + authorization disclaimer):
Session — Findings
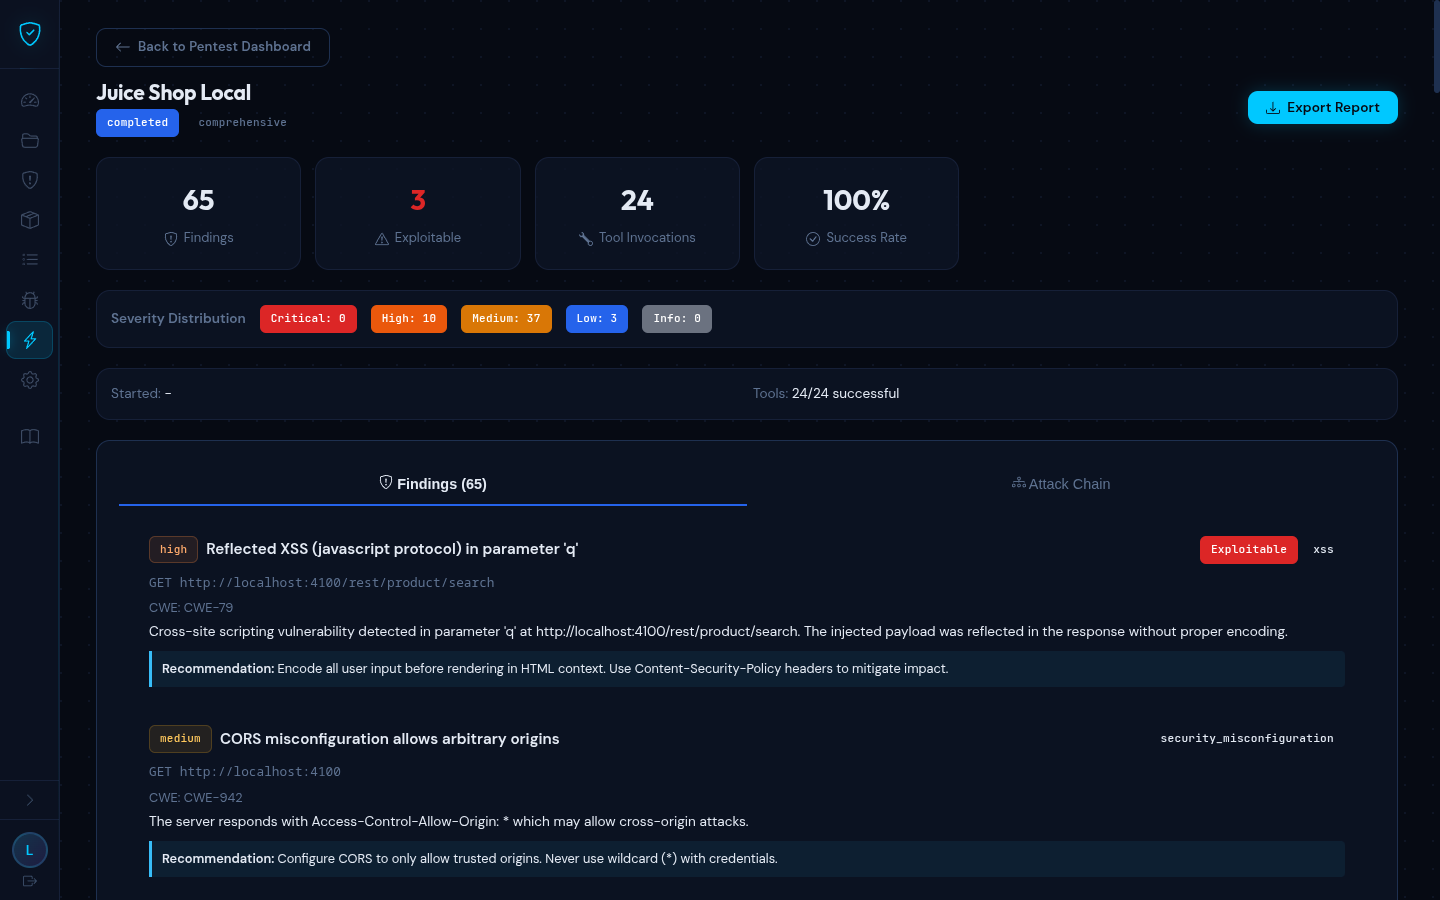
Each finding shows severity, CWE, endpoint, description, and remediation. Exploitable findings are flagged. SAST correlations are shown when available.
Session — Attack Chain
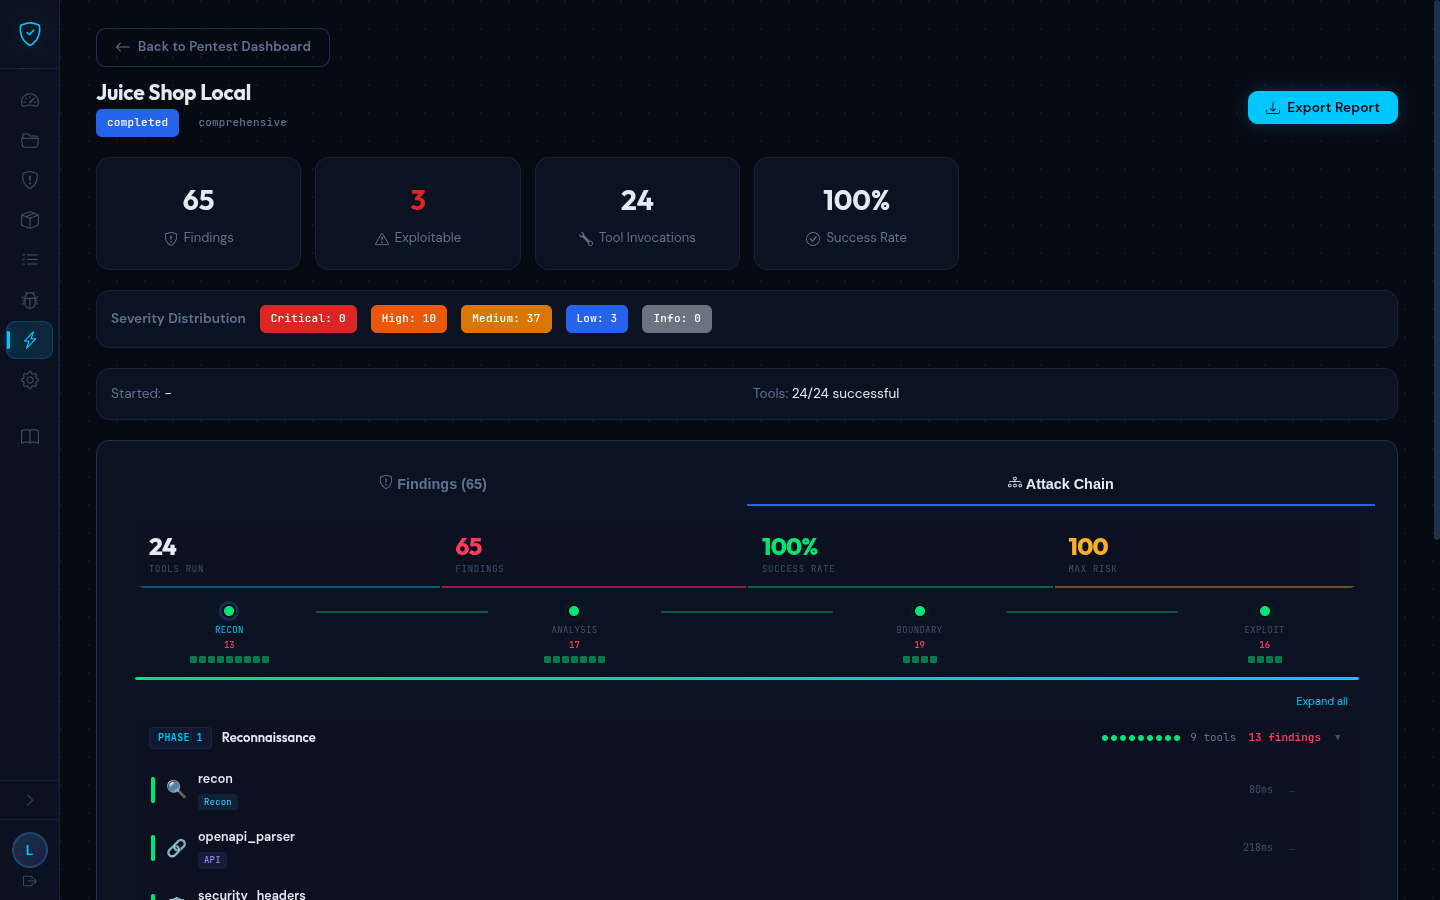
The attack chain visualizes the DAG of tool executions grouped into phases (Reconnaissance, Analysis, Boundary Testing, Exploitation). Each node shows tool name, category, duration, findings count, and risk score. Running nodes pulse with an animation.
Concurrency & Security
- Max 5 concurrent sessions via
tokio::Semaphore— returns HTTP 429 when exhausted - Credentials encrypted at rest with AES-256-GCM (key from
PENTEST_ENCRYPTION_KEYenv var) - Credentials redacted in all API responses (replaced with
********) - Credentials decrypted only when building the LLM prompt (in-memory, never logged)
- Report archives are AES-256 encrypted ZIPs with SHA-256 integrity checksums